
November 3, 2026
Why High Trade Counts Can Distort Performance Metrics
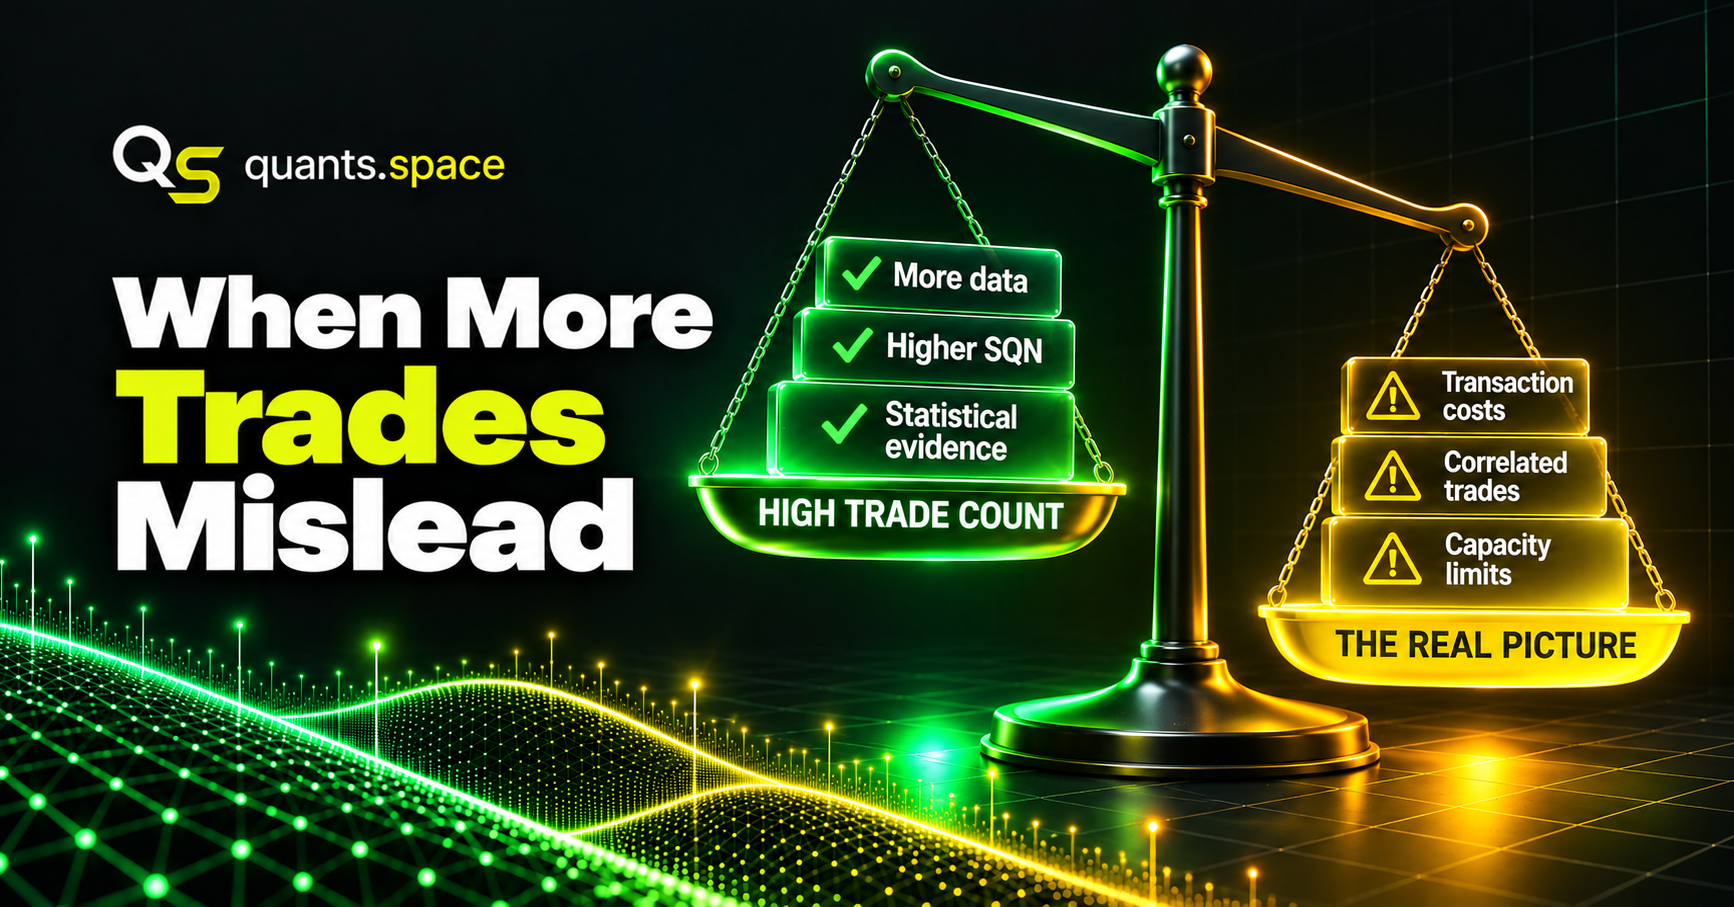
A quantitative strategy that executes thousands of trades may look more reliable than one that trades only a few times a week. It produces more observations, generates a larger dataset, and may appear to offer stronger statistical evidence. However, a high trade count does not automatically mean that a strategy is more profitable, consistent, or suitable for institutional investors.
Trading frequency affects how performance metrics are calculated and interpreted. It also influences transaction costs, market exposure, and strategy capacity. For institutional allocators, understanding these relationships is essential when comparing systematic trading strategies.
Why More Trades Can Look Like Better Performance
A larger number of trades provides more data for evaluating a strategy. When observations are sufficiently independent and representative, additional data can improve estimates of average returns, variability, and other statistical characteristics. This is one reason investors often prefer strategies with substantial trading histories.
However, some performance metrics incorporate the number of observations directly into their calculations. As a result, a strategy with more trades can receive a higher score even when its average return and return variability are identical to those of a less active strategy. The difference may reflect trading frequency rather than superior performance per trade.
System Quality Number (SQN) is one example. Its original formula combines average trade results, their standard deviation, and the square root of the number of trades. Consequently, the raw SQN increases with trade count when the other inputs remain unchanged.
Trade Count and Statistical Independence
A large dataset is most useful when its observations provide genuinely new information. In quantitative trading, however, individual trades are not always independent. Several positions may be opened using the same signal, respond to the same market conditions, or share exposure to a common risk factor.
Consider a strategy that simultaneously opens positions in several highly correlated technology stocks. Although each position is recorded as a separate trade, their outcomes may be driven by the same market movement. Counting them as independent observations can create an overly optimistic impression of the amount of evidence available.
This issue becomes particularly important for high-frequency and multi-asset strategies. Investors should examine correlations between positions, overlapping exposures, and the underlying signals that generate trades. A thousand closely related trades may provide less independent information than their number suggests.
Transaction Costs Can Reduce the Advantage
High trading frequency usually means more frequent interaction with the market. Each transaction may involve commissions, exchange fees, bid-ask spreads, and market impact. Even small costs can become significant when a strategy executes thousands of trades.
A strategy may generate attractive gross returns while producing much weaker results after execution expenses. This is particularly relevant for strategies targeting small price movements, where trading costs can absorb a substantial share of expected profits. Backtests that underestimate these costs may overstate the strategy's practical profitability.
Allocators should therefore review both gross and net performance. They should also examine the assumptions used to model transaction costs, including spreads, slippage, order sizes, and available market liquidity. Realistic execution assumptions are essential when evaluating high-turnover strategies.
High Trade Counts and Strategy Capacity
Trading frequency also affects the amount of capital a strategy can manage efficiently. A system that performs well with relatively small positions may encounter difficulties when deployed with substantially more capital. Larger orders can increase market impact, especially in less liquid instruments.
These challenges can be particularly significant for strategies with high turnover. Frequent trading requires repeated execution, and even modest increases in slippage can reduce net returns. As assets under management grow, the strategy may struggle to maintain its historical performance.
Investors should evaluate trading frequency alongside average position size, market liquidity, turnover, and estimated capacity. A large number of successful historical trades does not demonstrate that the strategy can scale without affecting execution quality. Capacity analysis helps determine whether attractive backtest results remain realistic at institutional allocation sizes.
Comparing Strategies With Different Trading Frequencies
Direct comparisons can be misleading when strategies operate at different frequencies. A medium-frequency strategy may execute several hundred trades annually, while a high-frequency strategy may generate thousands of transactions in a single day. Their performance statistics may reflect different observation counts, holding periods, and execution conditions.
The length of the evaluation period introduces another complication. A strategy tested over ten years will generally accumulate more trades than a comparable strategy tested over two years. Metrics influenced by sample size may therefore favor longer histories even when the underlying distribution of trade returns is similar.
To make comparisons more meaningful, allocators should examine average trades per day or year, the length of the backtest, and the market conditions covered by the data. Consistent evaluation periods can help reduce differences caused by historical coverage. Investors should also distinguish trade-level statistics from portfolio-level performance measures.
Why Portfolio-Level Metrics Still Matter
Trade-level statistics describe individual trading outcomes, but they do not fully capture how a portfolio behaves over time. A strategy can generate many profitable trades while remaining exposed to occasional large losses. It may also hold overlapping positions that increase concentration risk during periods of market stress.
Portfolio-level metrics provide additional context. Sharpe ratio, maximum drawdown, volatility, and the daily equity curve help investors understand the relationship between returns and risk. These measures can reveal characteristics that are difficult to identify from trade counts or average position returns alone.
However, portfolio-level metrics also have limitations. Their interpretation depends on the evaluation period, return distribution, valuation methods, and market conditions. Investors should use them alongside information about leverage, liquidity, execution costs, and strategy design.
What Institutional Allocators Should Examine
A high trade count can be useful, particularly when it provides a broad sample of trading outcomes across different market conditions. However, the quality of the evidence matters more than the number of observations alone. Investors need to understand how trades are generated and whether their outcomes represent genuinely different sources of return.
When comparing quantitative strategies, allocators should examine several factors:
- Trade frequency: How many positions does the strategy open per day or year?
- Return consistency: How do average trade returns compare with their variability?
- Position correlation: Do multiple trades share the same signals or market exposures?
- Transaction costs: Are reported results based on realistic execution assumptions?
- Strategy capacity: Can the strategy maintain its performance with more capital?
- Portfolio risk: What do drawdowns, volatility, and portfolio-level returns reveal?
These questions help investors distinguish between a large trading dataset and meaningful evidence of strategy quality. They also make it easier to identify differences that may be hidden by a single performance score.
Evaluating the Quality Behind the Numbers
High trade counts can strengthen performance analysis when the underlying observations are informative and execution assumptions are realistic. They can also make certain statistical metrics look more favorable without improving the strategy's average return relative to its variability. The interpretation depends on how trades are generated, measured, and combined into portfolio results.
For institutional allocators, the goal is to understand whether a strategy can generate consistent returns while managing risk and trading costs. Comparing trade-level statistics with portfolio performance, market exposure, and capacity provides a more complete picture. This approach helps investors assess systematic strategies on the quality of their results rather than trading activity alone.